Engagement Metrics Dashboard: A starting point for increasing constituent engagement
This content was previously published by iModules, now part of Anthology. Product and/or solution names may have changed.
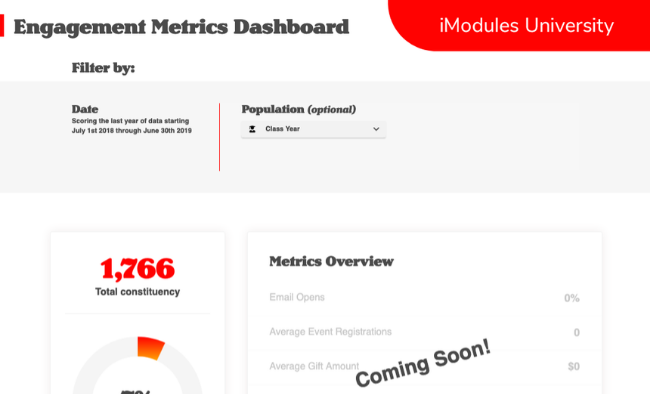
Knowing who your most highly-engaged supporters are is vital to your institution’s fundraising success. It can help you identify those who have not yet given, as well as those who have given but might be able to give more or support you in a different way. The new Engagement Metrics Dashboard provides a refined view of how your constituents are engaging with your institution and offers a benchmark to use for planning purposes to improve the percent of engaged supporters over time. Currently, the Engagement Metrics Dashboard includes online giving, online usage, events, and membership data with email data being added in early Q1. Take a few minutes to check it out and then see how much the percent engaged increases once email data is included.
While this is helpful, the engagement dimensions provide more information about where engagement is coming from. Through the dimensions, an institution can see the percentage of constituents engaged in each of the areas and clarify how groups of individuals engage.
Below are some quick tips on getting the most from the Engagement Metrics Dashboard:
- Use the class year selector to begin to identify differences in engagement by class year. This will provide more information about how different class years are engaging (email vs. events, etc.). Understanding these differences can lead to changes in strategy. For example, there may be an opportunity to look at event programming for those years that have higher email engagement, or to change the e-solicitation strategy for those groups.
- Focus on email address acquisition. Classes with a higher percent who are engaging via email are more likely to have a higher percentage who are also participating in other ways. Encourage your team to gather more emails for graduates, especially in class years with lower email engagement.
- Pro Tip: As your Encompass email data is introduced to the Engagement Metrics Dashboard in early Q1 2020, you'll see the impact in the overall percent engaged for both your entire constituency and the segments you identify through filters.
- Use available tools in Encompass to keep your data clean so that all activity for each of your constituents is presented on the dashboard.
- Enable pre-population on all forms, making it easy for constituents to take the wanted action of updating their info, registering for an event, or making a gift, by populating their information for them. This also saves activity to their constituent record.
- Use Identity Checkpoint on all forms and be sure to merge records in the merge grid to tie activity to the constituent record.
This dashboard is the starting point for Engagement Metrics in the Encompass platform – watch for updates and for more information on how to take advantage of this new tool.
For more information on how you can maximize the Engagement Metrics Dashboard and Encompass Decision Analytics at your institution, please contact your Customer Success Manager.