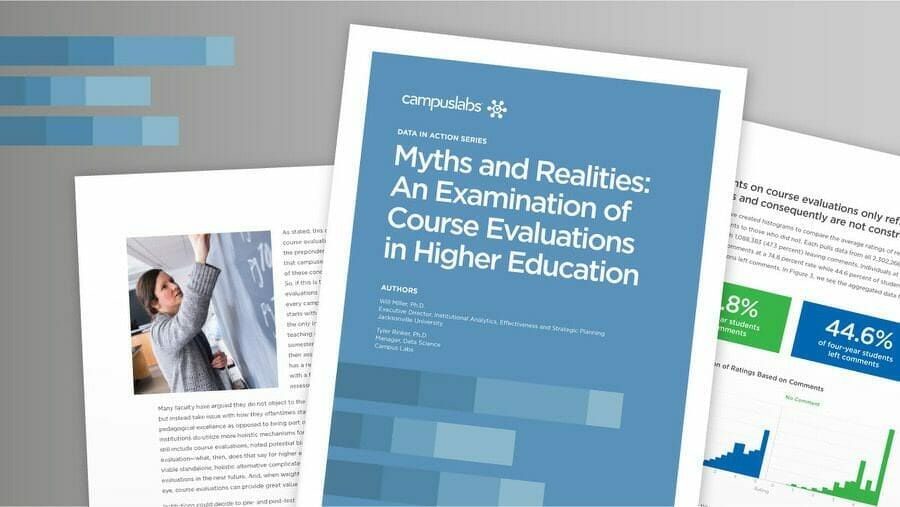
Myths and Realities: An Examination of Course Evaluations in Higher Education
This content was previously published by Campus Labs, now part of Anthology. Product and/or solution names may have changed.
White Paper overview
One topic of longstanding debate in higher education is that of course evaluations. While the questions, scales, methods for administration and weights applied to student ratings of instruction may vary significantly from campus to campus, the political nature of course evaluations and concerns about student biases are fairly consistent.
Measured biases make the topic even more important for discussion and analysis. These biases—whether focused on race, gender or other factors associated with an instructor—are typically implicit, which makes them problematic to correct for since a student likely is unaware of the underlying causes of their ratings. And for women and minority faculty, there is a legitimate assumption that they are held to a higher standard than their white, male counterparts—an area that necessitates continued examination in our industry.
Still, many faculty have argued they do not object to the concept of course evaluations, but instead take issue with how they oftentimes stand alone as unitary measures of pedagogical excellence as opposed to being part of a more holistic view. How this data is collected unquestionably matters, so too does what we do with it.
Regarding limitations, since this is pulled data from the Campus Labs system, we are unable to investigate any hypotheses related to course grades or gender and ethnicity biases, as those data points are not reliably made available to Campus Labs by the sampled campuses—this is an area in which we recognize the need for further industry study.
Individual institutions should examine how student feedback is captured and used—if done properly, it can lead to a richer way of understanding what is and what is not working in our classrooms. To meaningfully do this, though, we need to be able to separate some of the myths and realities surrounding course evaluations. In this research project, we present and analyze six commonly held beliefs regarding course evaluations and attempt to assess the veracity of each.
- Students who take course evaluations outside of class time are more likely to be critical in their comments and ratings
- Comments on course evaluations only reflect the extremes and consequently are not constructive
- Course evaluation instruments do not accurately measure what faculty and administrators want
- Low response rates skew course evaluation results
- Respondents have a consistent attitude across different evaluations
- Evaluation comments can be a predictor for average rating on course evaluations
To examine the veracity of these beliefs, we utilized data gathered from 12 institutions of higher education in the United States that make use of the Campus Labs course evaluation system for conducting their student feedback process. Campus Labs routinely uses data collected from its partner institutions to provide landscape analyses and takes necessary steps to anonymize this data.
The institutions in this study were intentionally selected to ensure adequate response counts, geographic dispersion and representation of various institution types to the extent possible. The data includes responses from July 1, 2016, onward in order to maintain recency and manage the total number of datapoints being examined. In total, more than 216,000 respondents provided the 2.3 million evaluation responses used to examine each belief.
216,000
Respondents
2.3 million
Evaluation Responses
Below is a sample of analysis for a selection of the evaluated beliefs—download the whitepaper for a full analysis of all six beliefs, including data for each.
Students who take course evaluations outside of class time are more likely to be critical in their course evaluation comments and ratings
To analyze this commonly held belief, we aggregated data for respondents at all examined institutions, averaging out students’ ratings after rescaling answers into a five-point scale and by hour in which they were completed. Given the geographic diversity of institutions represented, the time zones were all adjusted to Eastern time.
We arbitrarily set class time hours to between 8 a.m. and 4 p.m., estimating that the bulk of campus courses occur during this timeframe—we acknowledge that evening classes and some two-year institutions are more likely to have an increased number of classes after 4 p.m.

Contrary to what this belief suggests, the graph above shows that evaluations completed during class times are likely to be slightly more critical in average rating than out-of-class responses—and the trend is fairly steady. The highest average ratings, based on the graph above, occur around 6 a.m. with the lowest happening at noon. In the graph below, we see the division between two- and four-year institutions, time of day completed and overall ratings.

These results add a series of additional layers to consider. First, the split graphs show that overall, average ratings run approximately two-tenths of a point higher for our sampled two-year institutions compared to their four-year counterparts. Moreover, the impact of time the evaluations were completed disappears for the two-year institutions. While four-year institutions show peaks outside of typical class times and a valley during, two-year institutions have a more consistent distribution.
Ultimately, results demonstrate the idea that students tend to be more critical when completing online evaluations outside of traditional class times is incorrect—and for four-year institutions, the opposite appears to be the case.
Course evaluation instruments do not accurately measure what faculty and administrators want
In order to examine this belief, we utilized our Campus Labs algorithm for classifying course evaluation questions—click here for more details—to categorize the 3,898 various questions included in this analysis into 23 separate categories focused on student growth, assessment, instructor behaviors, course design and facilities.

While the lollipop graphic is useful to examine the results in aggregate, it is less useful when comparing two- and four-year institutions. Consequently, we have created slope graphs that directly compare the distributions for each question type, showing how the question themes differ between two- and four-year institutions.

Based on the types of questions asked on course evaluations, it appears two-year institutions are more directly interested in assessing the effectiveness of the instructor while four-year institutions more routinely emphasize courses, assessment and students. What this data suggests is that there are measurable differences across several themes in how course evaluation instruments are constructed at institutions of various levels. Though, the unearthing of these various differences does not provide any evidence regarding this overarching belief. If different focal points emerge due to deliberate design choices by faculty and administrators at two- and four-year campuses, then the instruments very well could be measuring what faculty and administrators want.
If, however, these discrepancies surface due to random chance, we may need to encourage greater intentionality in how evaluations are formulated. After all, it does not matter how many students respond if we are not asking meaningful questions that provide actionable data for faculty.
Conclusion and Suggested Areas for Further Research
The analyses for each commonly held belief in this paper hopefully show the possibilities and power of examining course evaluation data as more than a point-in-time mechanism for evaluating faculty effectiveness in the classroom. The data used from our sample institutions should be available on any campus in order to duplicate the analyses and for the identification of campus-specific intricacies. Moreover, individual campuses have the data to take the analyses a step further and examine how grades, gender and other demographic factors impact evaluation ratings. With our anonymized data from the campuses used in this particular study, we were unable to do so, even if we know those are some of the more interesting—and for many, most pressing—beliefs about course evaluations.