
Equity-Centered Dashboards: Leveraging Data Visualization to Illuminate Student Outcomes
Higher education is laden with inequitable student outcomes – from access to college, progression and degree completion, involvement, and engagement in co-curricular and experiential learning opportunities to post-graduation outcomes. Many campuses set key performance indicators and goals to identify those inequities. Still, they are often confused about identifying the relevant metrics to track over time and how to best use real-time data for ongoing intervention and organizational change. Data visualization – specifically using intentionally designed dashboards – can help campuses illuminate the inequities, thus allowing stakeholders to discuss interventions, programs and the systemic change required to move toward more equitable outcomes. When creating data visualizations, it is critical to create simple, dynamic, and easily understood metrics and graphics that the average consumer can easily understand and draw meaning.
How Dashboards Advance Equity
- Good dashboards make data readily available and transparent. They are easy to understand and designed to allow the viewer to draw quick, informed conclusions about a program or service. Dashboards advance equity by increasing transparency.
- Dashboards move data from local perspectives to aggregated, cross-functional views of collective impact. Rather than simply disaggregating the attendance of 250 students at a single leadership program by class year, dashboards allow an institutional student engagement perspective into multiple leadership events. This advances equity by increasing awareness about how many students attended and enables visual comparison across a variety of demographic indicators, including race, ethnicity, gender, nationality, and socioeconomic status.
- Dashboards are interactive. Producing and consuming disaggregated data requires interaction and collaboration by multiple stakeholders. Dashboards advance equity when various people with different identities and lived experiences collaborate to create the dashboard. They also advance equity by engaging dashboard users in drilling into metrics in real-time. Dashboards provoke curiosity and empower end-users to explore.
- Dashboards hold institutions accountable for their equity goals and metrics. Aligning program and division or college metrics with institutional equity goals or KPIs on dashboards allows professionals to readily identify if they are keeping their promise to students and meeting priorities set forth by the institution. Dashboards are useful to keep track of ongoing progress to use the data for continuous improvement and for sharing with external partners such as accreditors, funders, and the public to demonstrate progress toward equitable outcomes.
Equity Indicators and Metrics
Higher education practitioners often default to persistence, retention, and graduation metrics as indicators of equity, and when using an equity lens, they disaggregate these metrics to understand better how various populations of students fare at their institution. These metrics are a signpost of institutional progress, but the data is generally available when most campuses are no longer positioned to intervene and support students. Dashboards, updated continuously, allow faculty and staff to use leading indicators for intervention, support, and program adjustment at critical points that will positively impact student retention and learning. Examples of leading indicators include related to student persistence, retention and graduation include:
- Number of events hosted in the first three weeks as well as number of students attending events in the first three weeks, or those who have not yet attended an event in the first three weeks by core demographic areas.
- Percent of students who have registered for classes and those who have not by critical institutional deadlines.
- Number of students who drop or withdraw from a class at critical time points throughout the semester.
- Attendance at well-ness programming during peak points in the student life cycle that are high stress.
Example in Practice
At Western Michigan University (WMU), a small task force of Student Affairs practitioners came together to develop a dashboard to advance equity. The task force conceptualized equity as three phases to advance equity: representation, aligning resources with student needs and disrupting inequitable systems and structures. A guiding principle for this team was to focus on making tangible equity gains using the three-part framework. WMU focused on three core areas to examine metrics and build dashboards.
- Student employment: What was the racial demographic of students employed in student affairs? Did the demographic of paid positions align with and accurately represent the institutional demographic? What was the average pay for men and women? Capacity for disaggregated analysis was limited due to the gender binary of institutional demographics.
- Student Engagement: In examining event offerings and attendance, were programs that engaged diverse students being offered? What did engagement look like across diverse populations? Were all populations within 3-5% of one another? Beginning with representation, event attendance was disaggregated by race, sex, and first-generation /continuing generation student status.
- Food Pantry Usage: Are the students who may most need the food pantry using the food pantry? A relevant and imperfect proxy variable for student need was used to estimate if the students who might need the campus food pantry were using the service.
With the existing data at hand, the team spent time making sure they understood the metrics reflected on the dashboard and developed a plan with strategies that articulated the current number of engaged students (67.4%), a target to engage each demographic group within 3-5% of the average, and programmatic and outreach strategies with timelines to reach the target.
Snapshot of Advancing Equity in Student Affairs at Western Michigan University
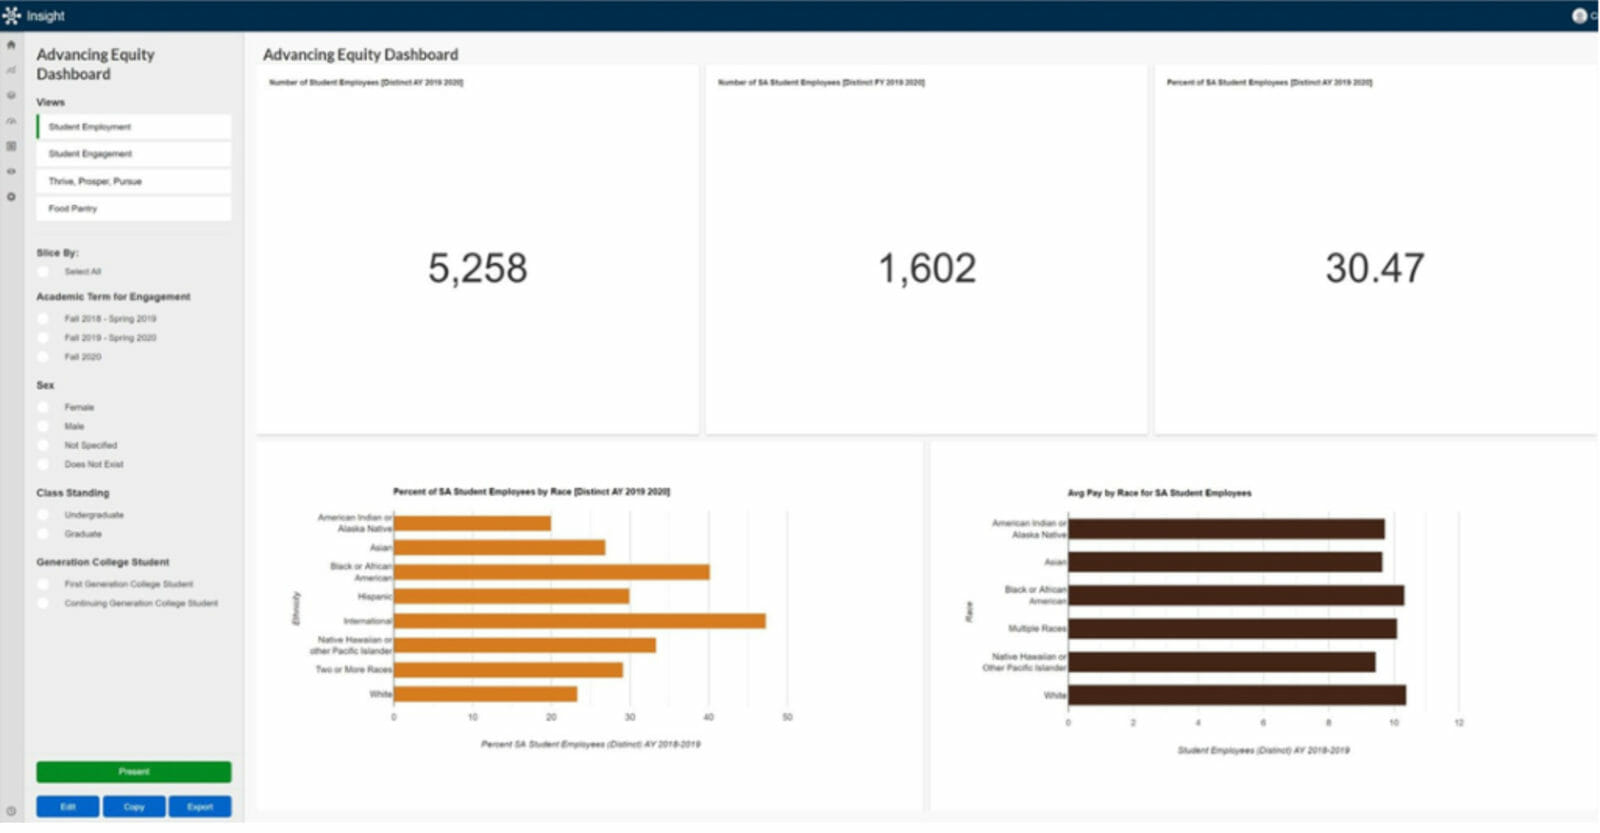
The dashboard snapshot shown allowed us to see the number of student employees at the institution in the division of student affairs and the percent of students employed by Student Affairs at Western Michigan University. The same dashboard shows the racial and ethnic demographic of student employees in the division and the average page by racial/ethnic demographic. The Advancing Equity in Student Affairs task force built this dashboard to answer the questions: do our student employees reflect the diversity of the larger student body? Is student affairs a leading employer of students on campus? There are often pay disparities in the larger socio-cultural and economic contexts; are we replicating those disparities in student affairs? On the left were slicers that allowed us to dig more deeply into these numbers by sex, first-generation college student status, and undergraduate/graduate status.

Ciji A. Heiser
